BBC Weather Nottingham: monthly averages, not a live forecast
See Nottingham’s monthly average high temperatures, November rainfall, and recorded extremes. Figures are historical (not live predictions), so check forecasts for day-to-day plans.
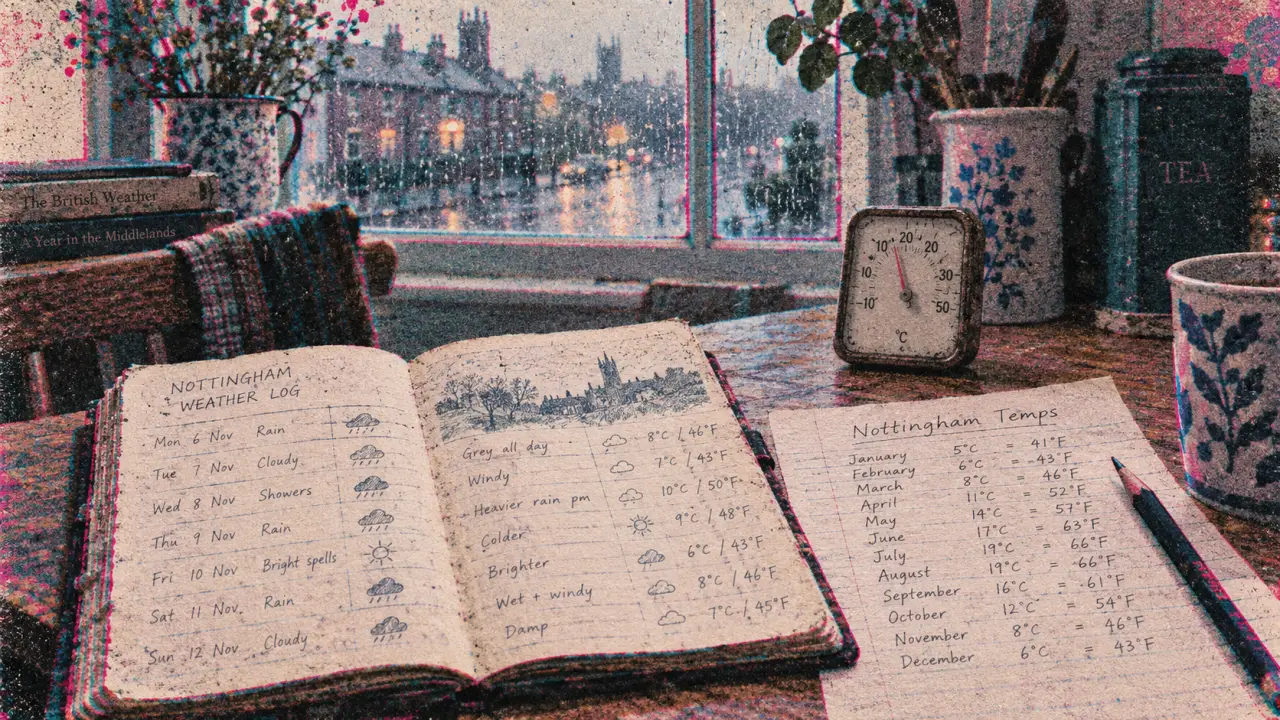
For today’s conditions and the coming days, use BBC Weather’s Nottingham forecast. This page records historical temperatures and rainfall separately: its averages are not predictions for your journey or outdoor plans.
Method and recording period
The figures below use Open-Meteo.com’s ERA5, Copernicus series for Nottingham, covering 1 October 2016 to 30 September 2026. They are not BBC observations or Met Office climate normals. November figures are identified separately from the monthly temperature series.
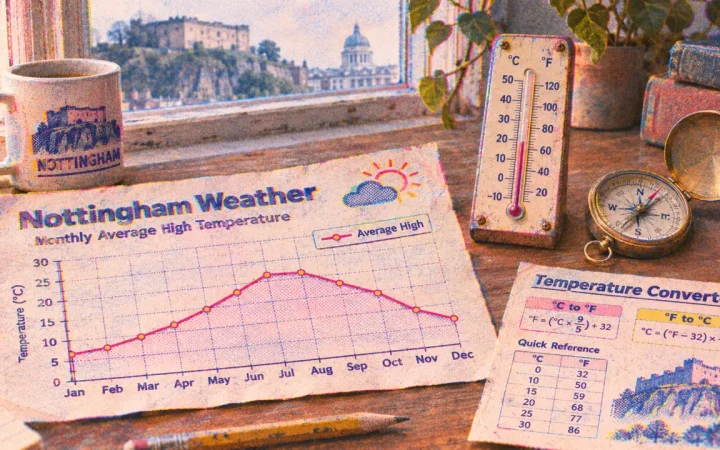
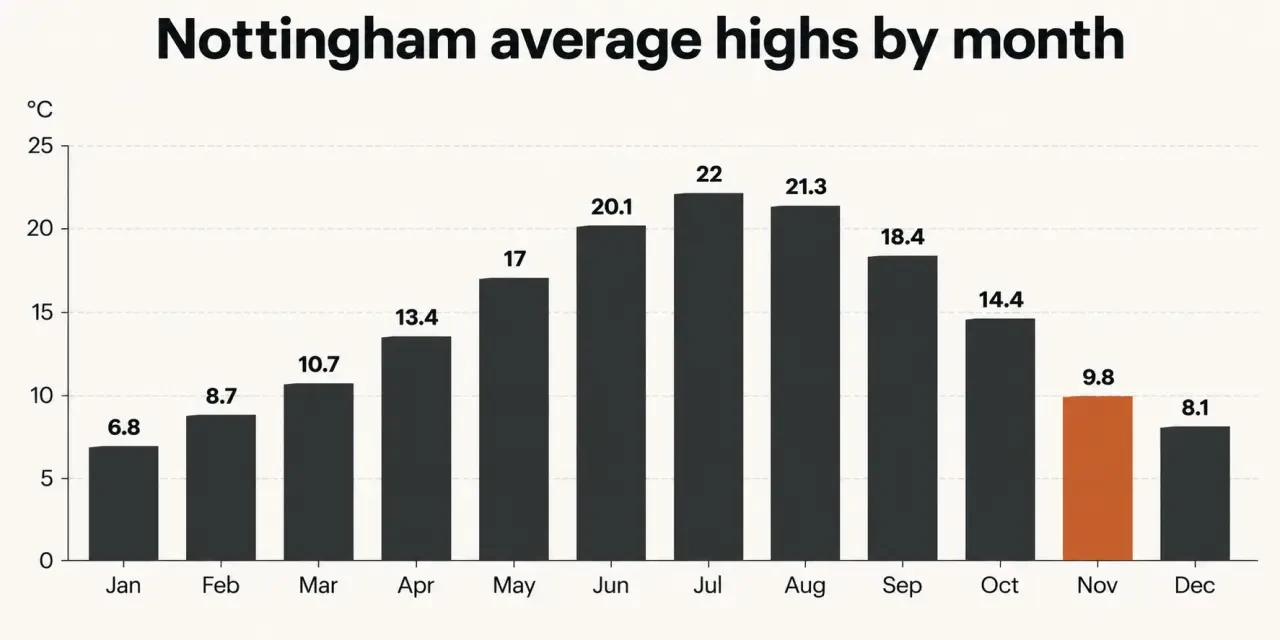
Nottingham’s monthly average highs
The monthly average high temperatures in that series are:
| Month | Average high |
|---|---|
| January | 6.8°C |
| February | 8.7°C |
| March | 10.7°C |
| April | 13.4°C |
| May | 17°C |
| June | 20.1°C |
| July | 22°C |
| August | 21.3°C |
| September | 18.4°C |
| October | 14.4°C |
| November | 9.8°C |
| December | 8.1°C |
November rainfall and recorded extremes
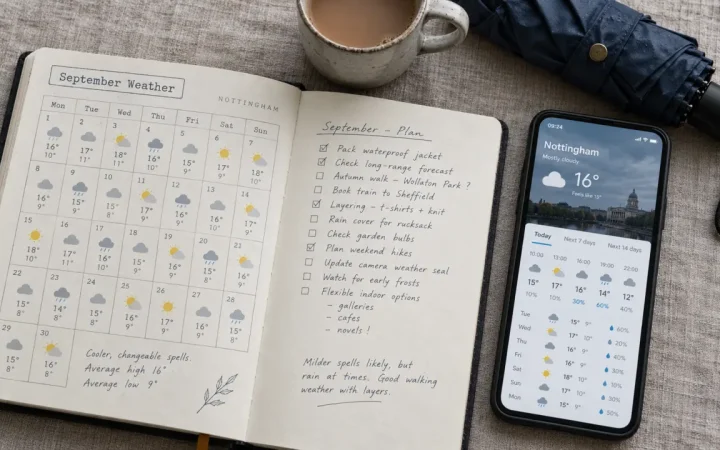
November averages are 9.8°C for the high, 4.7°C for the low, 72 mm of rainfall and 12.1 rainy days. Across the ten-year period, the highest temperature was 38.1°C and the lowest was −8°C. September 2026’s average high was 19.7°C, a difference of 1.3°C above its September average.
BBC Nottingham weather for daily decisions
The seasonal rhythm helps with broad planning; the forecast supplies the timing. An average of 12.1 rainy days does not mean rain arrives at regular intervals, or tell you whether your particular walk will stay dry.
Use the Met Office Nottingham forecast or BBC Weather for current planning, rather than treating historical averages as tomorrow’s weather.