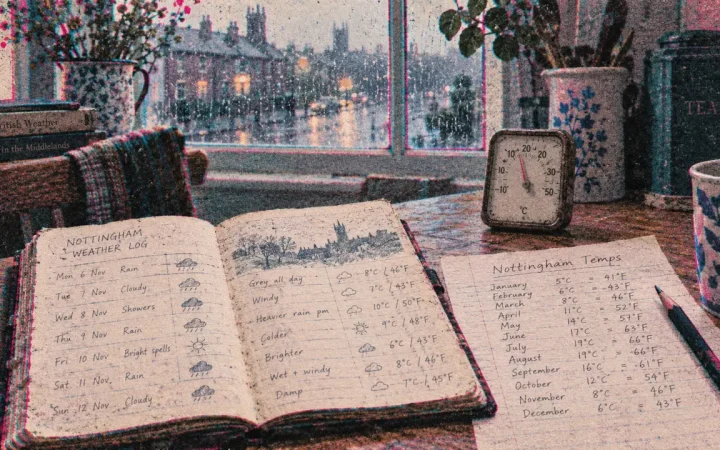
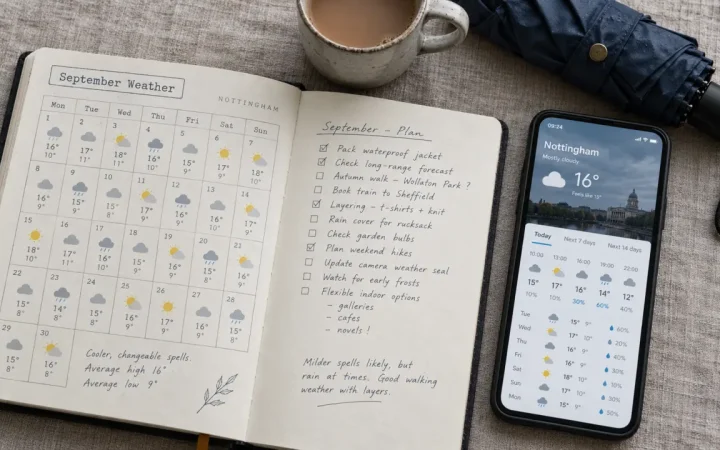
West Bridgford Nottingham weather: monthly averages, not a live forecast
Find West Bridgford monthly temperature highs and November rainfall totals from historical records. Great for seasonal planning, but not for today’s conditions or active weather warnings.
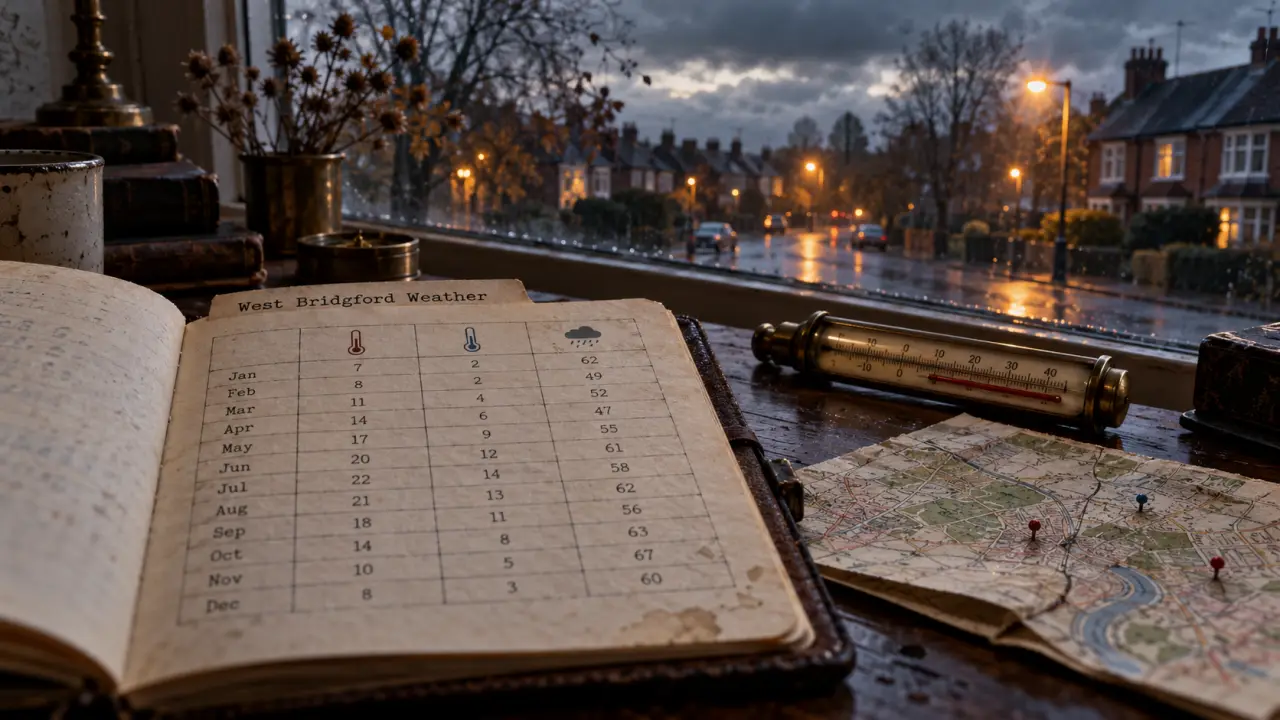
Looking for today’s weather in West Bridgford? These historical figures do not establish current conditions, rain timing or active warnings. They provide a Nottingham reference for seasonal planning, rather than a verified West Bridgford forecast.
Monthly temperatures across the year
The monthly average highs reported by Open-Meteo.com (ERA5, Copernicus) cover October 2016 to September 2026.
| Month | Average high |
|---|---|
| January | 6.8°C |
| February | 8.7°C |
| March | 10.7°C |
| April | 13.4°C |
| May | 17°C |
| June | 20.1°C |
| July | 22°C |
| August | 21.3°C |
| September | 18.4°C |
| October | 14.4°C |
| November | 9.8°C |
| December | 8.1°C |
November rain and overnight temperatures
For November, the same Open-Meteo.com historical series gives an average low of 4.7°C, average rainfall of 72 mm and 12.1 rainy days. These are monthly reference values, not predictions for a particular journey or outdoor event.
What the averages can conceal
An average can act like a mask: a single reassuring temperature hides the range behind it. The ten-year series includes extremes of 38.1°C and -8°C. Neither describes a typical day, but both show why a seasonal average should not determine what to wear tomorrow.
For immediate plans in West Bridgford, check a current, location-specific forecast and its issue time. Historical rainfall totals cannot tell you when showers will arrive, and these figures do not establish whether any weather warning is active.