Met Office Nottingham: live forecasts and a separate 10-year temperature record
Get the latest Met Office Nottingham forecast, then explore a separate 10-year temperature record (2016–2026): monthly average highs, overall extremes, and how September 2026 compares.
Looking for today’s weather? Use the Met Office Nottingham forecast for current predictions. The historical figures below come from Open-Meteo.com, not the Met Office, and cover 1 October 2016 to 30 September 2026.
Met Office Nottingham forecast and warnings
Keep the Nottingham weather warnings page separate from historical comparisons. An average cannot establish whether rain, strong winds or disruption are expected on a particular day. No live conditions or active warning status are reported here.
Nottingham’s temperature pattern across the year
The Open-Meteo.com ERA5, Copernicus series gives these average daytime highs for the ten-year period:
| Month | Average high |
|---|---|
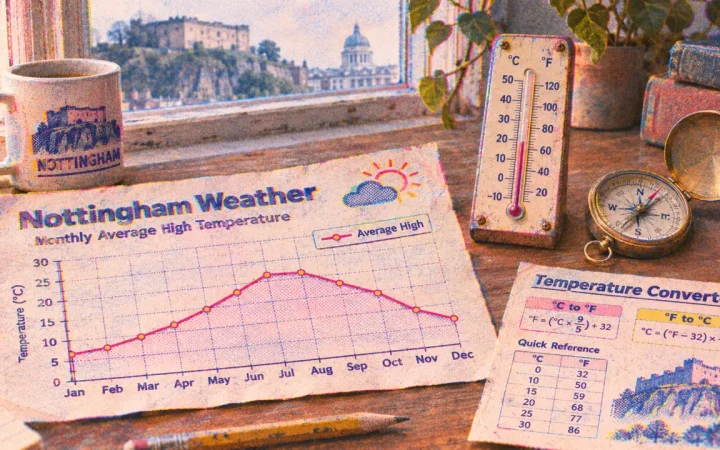
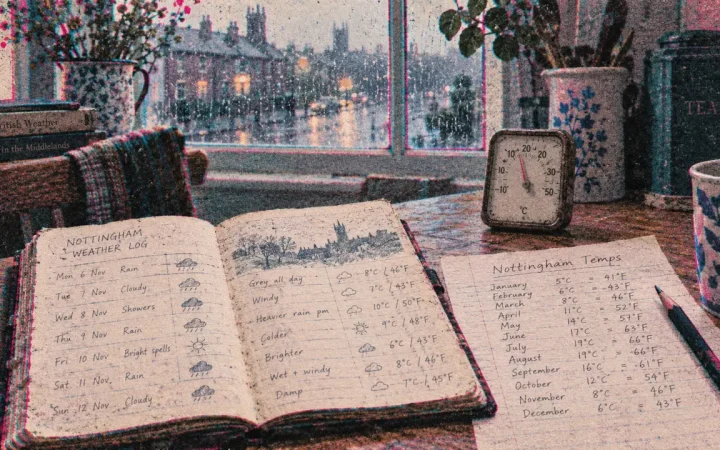
| January / February / March | 6.8°C / 8.7°C / 10.7°C |
| April / May / June | 13.4°C / 17°C / 20.1°C |
| July / August / September | 22°C / 21.3°C / 18.4°C |
| October / November / December | 14.4°C / 9.8°C / 8.1°C |
Across the same period, the highest temperature was 38.1°C and the lowest was -8°C. These are historical extremes, not forecast limits. Figures: Open-Meteo.com, ERA5, Copernicus.
September’s comparison offers a planning lever
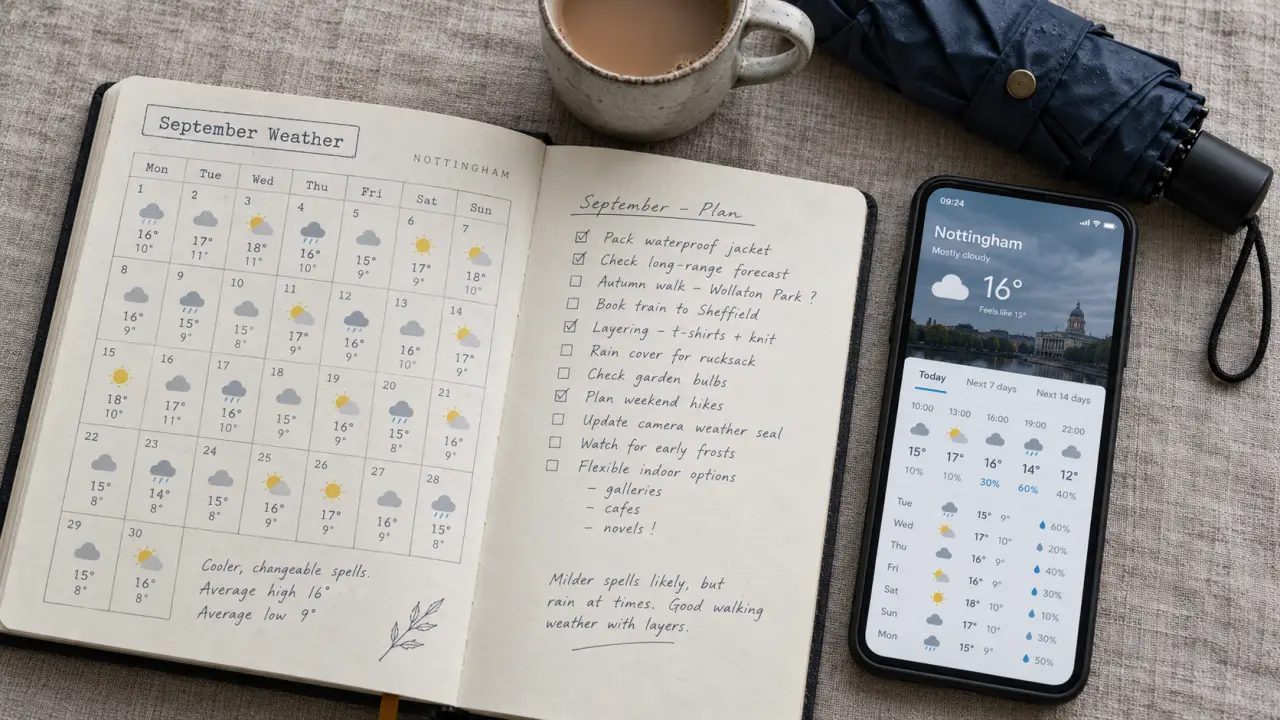
September 2026’s average high was 19.7°C, a difference of 1.3°C above the September average of 18.4°C, according to the same historical series.
For outdoor plans, treat the seasonal average as a starting point, then use the forecast as the decision lever. Comparing September with September, rather than November, avoids mistaking an ordinary seasonal change for an unusually warm or cold spell.