Temperature in Nottingham, England: monthly average highs from 6.8°C to 22°C
Découvrez les températures maximales moyennes mensuelles à Nottingham, d’environ 6,8°C en janvier à 22°C en juillet. Focus sur novembre, les précipitations moyennes, et les extrêmes historiques.
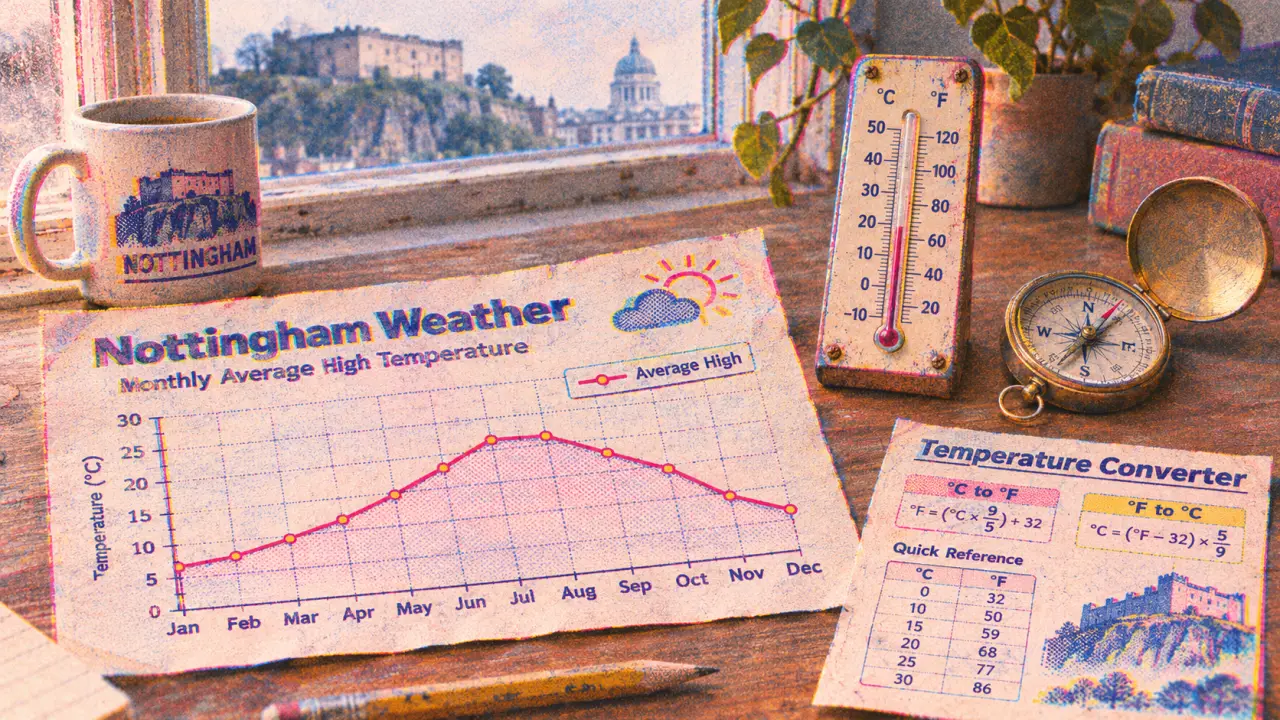
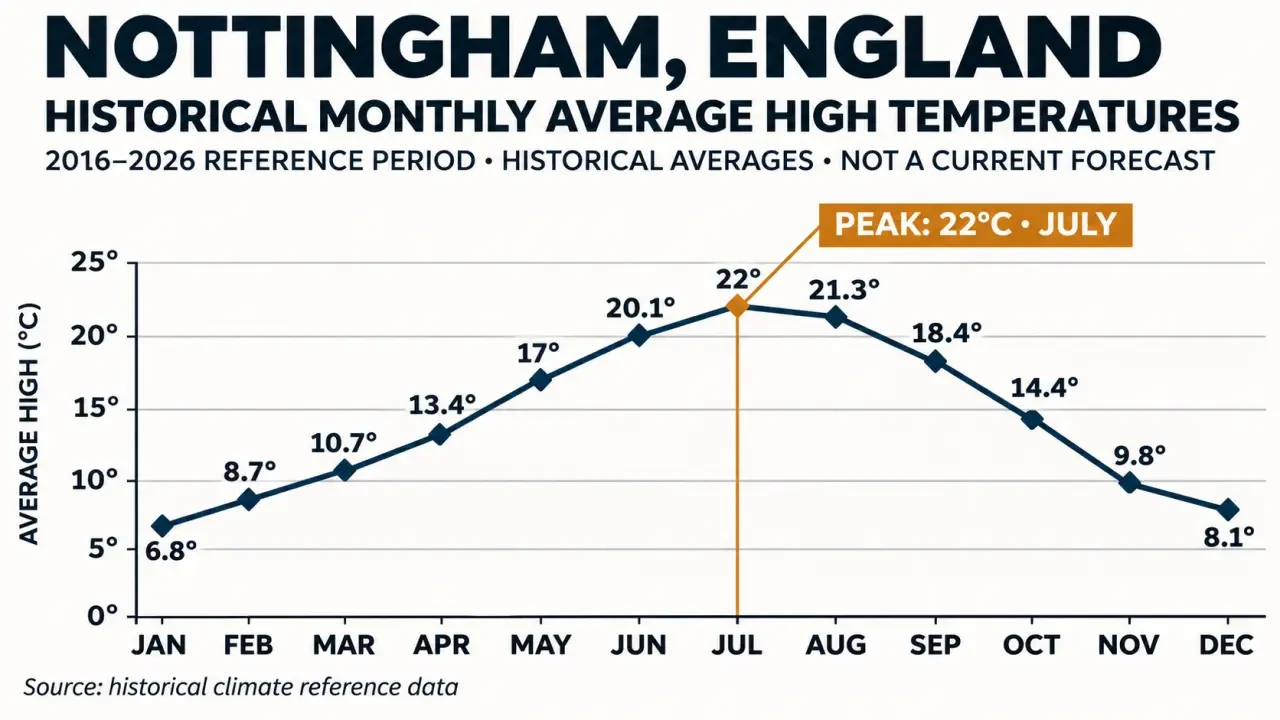
Nottingham’s average daytime highs range from 6.8°C in January to 22°C in July in the historical series used here. These figures describe temperature in Nottingham, England, across the year, not the weather today. All temperatures are in degrees Celsius; the reference period runs from 1 October 2016 to 30 September 2026.
Monthly average high temperatures in Nottingham
The monthly series gives a more useful picture of Nottingham’s seasonal temperatures than a single annual figure. Each value below is an average high, rather than an all-day mean or the highest temperature reached during that month. The figures come from Open-Meteo.com, using ERA5, Copernicus, for the stated reference period.
| Month | Average high |
|---|---|
| January | 6.8°C |
| February | 8.7°C |
| March | 10.7°C |
| April | 13.4°C |
| May | 17°C |
| June | 20.1°C |
| July | 22°C |
| August | 21.3°C |
| September | 18.4°C |
| October | 14.4°C |
| November | 9.8°C |
| December | 8.1°C |
January has the lowest average high in this series, while July has the highest. Average highs rise through spring, remain above 20°C in June, July and August, then fall through autumn. September’s 18.4°C and October’s 14.4°C help show that transition without treating either month as having one fixed daily temperature.
November temperature and rainfall averages
November’s historical average high is 9.8°C, with an average low of 4.7°C. These are November figures, not annual averages for Nottingham. Keeping the month attached to both values matters: using them as a year-round description would obscure the seasonal pattern shown in the monthly table.
The November rainfall figures are an average of 72 mm and 12.1 rainy days, from the same Open-Meteo ERA5, Copernicus series. Rainfall amount and rainy-day count describe different aspects of the month. Neither figure gives the timing of rain on a particular day, and the decimal rainy-day figure is an average rather than a count for one individual November.
For residents or visitors considering a November outing, these figures provide a seasonal baseline only. The average high is not a promised afternoon temperature, and the average low is not a lower limit. They should not be used to decide whether a particular journey or outdoor activity will be dry.
Historical extremes and the September comparison
The highest temperature in the ten-year record is 38.1°C, and the lowest is −8°C, according to Open-Meteo.com, using ERA5, Copernicus. These are extremes within the stated reference period. They are not presented as Nottingham’s all-time station records, and they should not be confused with the monthly average highs.
The distinction is important when judging what is typical. July’s average high of 22°C describes the monthly average, whereas 38.1°C identifies an exceptional value within the record. The two figures answer different questions: one concerns the seasonal baseline; the other concerns the upper end of this particular historical series.
For September 2026, the average high was 19.7°C, a difference of 1.3°C above the September average of 18.4°C. This is a dated historical comparison, not a rolling “last month” reading. Naming the month keeps the comparison meaningful when the page is read later.
Method, reference period and practical limits
The historical figures use Open-Meteo.com’s ERA5, Copernicus series for Nottingham, England, United Kingdom. The reference window is 1 October 2016 to 30 September 2026. Attribution and access are provided through the Open-Meteo historical archive endpoint. This page presents that defined ten-year series, rather than claiming a longer climate-normal period.
For seed sowing or moving young plants outdoors, the useful distinction is between an average and a threshold. A monthly average high cannot establish that every night will stay above a plant’s minimum temperature. Use the seasonal figures to frame the timing question, not to settle it: the historical low and the monthly daytime average are not interchangeable measures of growing conditions.
No live temperature or forecast is shown here. The page does not report today’s feels-like temperature, hourly rain probability, wind speed or gusts. Historical averages cannot supply those readings. For an immediate decision about clothing, travel or an outdoor event, a time-stamped forecast is needed alongside—not replaced by—this seasonal record.